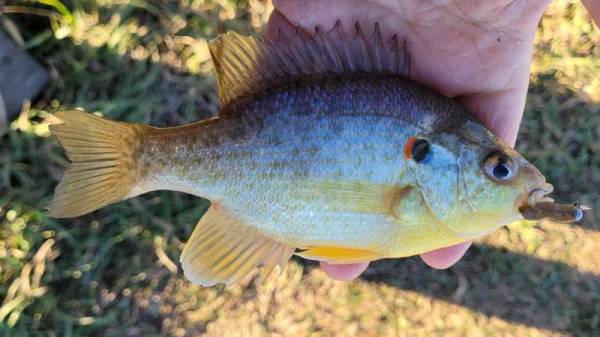
Avg growth rate per day for the group 1.66mm per day from May 31 - Oct 19 Avg RW 143%
Of the last (2) fish I sampled.
Avg RW of 144%
I find the RW avg interesting as a group vs the last 2.
Boon, there is variability in the data and each time period has a limited sampling of the population. There is always risk of having samples that do not reflect the population. IOWs the average at some sample date does not reflect the average of the population. This is uncertainty and the only way to reduce it is by having larger sets of samples. It is interesting. So one may conclude the RW didn't change over the course of time just from fact the RW didn't change much of the two periods. I would recommend looking at trends in the data. You can do that by charting the RW in your excel worksheet. Right clicking on the data in the chart you can also add a trendline to see what the data is suggesting.
The trends are consistent with what you earlier thought and what prompted the initial forage supplement. The trends are also consistent with a positive response to supplementation. It is possible that the trends were not reflective of the population. Now if this is so, one may ask why even bother sampling? The simple answer is to do it because it is the best we have to work with (which includes the potential shortcomings).
Each of graphs below are across a different period. The first through September 23. The second all data, while the third is from September 21 to October 20.
It isn't what we don't know that gives us trouble, it's what we know that ain't so - Will Rogers


![[Linked Image]](https://forums.pondboss.com/ubbthreads.php?ubb=download&Number=20649&filename=Boon%20RW%20through%20Sept%2023.jpg)
![[Linked Image]](https://forums.pondboss.com/ubbthreads.php?ubb=download&Number=20650&filename=Boon%20RW%20through%20Oct%2020.jpg)
![[Linked Image]](https://forums.pondboss.com/ubbthreads.php?ubb=download&Number=20651&filename=Boon%20RW%20Sept%2021%20through%20October%2020.jpg)